Case study · Insurance distribution platform
e123
e123 runs an insurance distribution platform managing a sprawling network of agencies and agents. The question wasn't how to design one product, but which of two to build next. So over five weeks we prototyped both as working software, ran them on 1,000+ realistic agents, and let real reactions decide.
Where it started
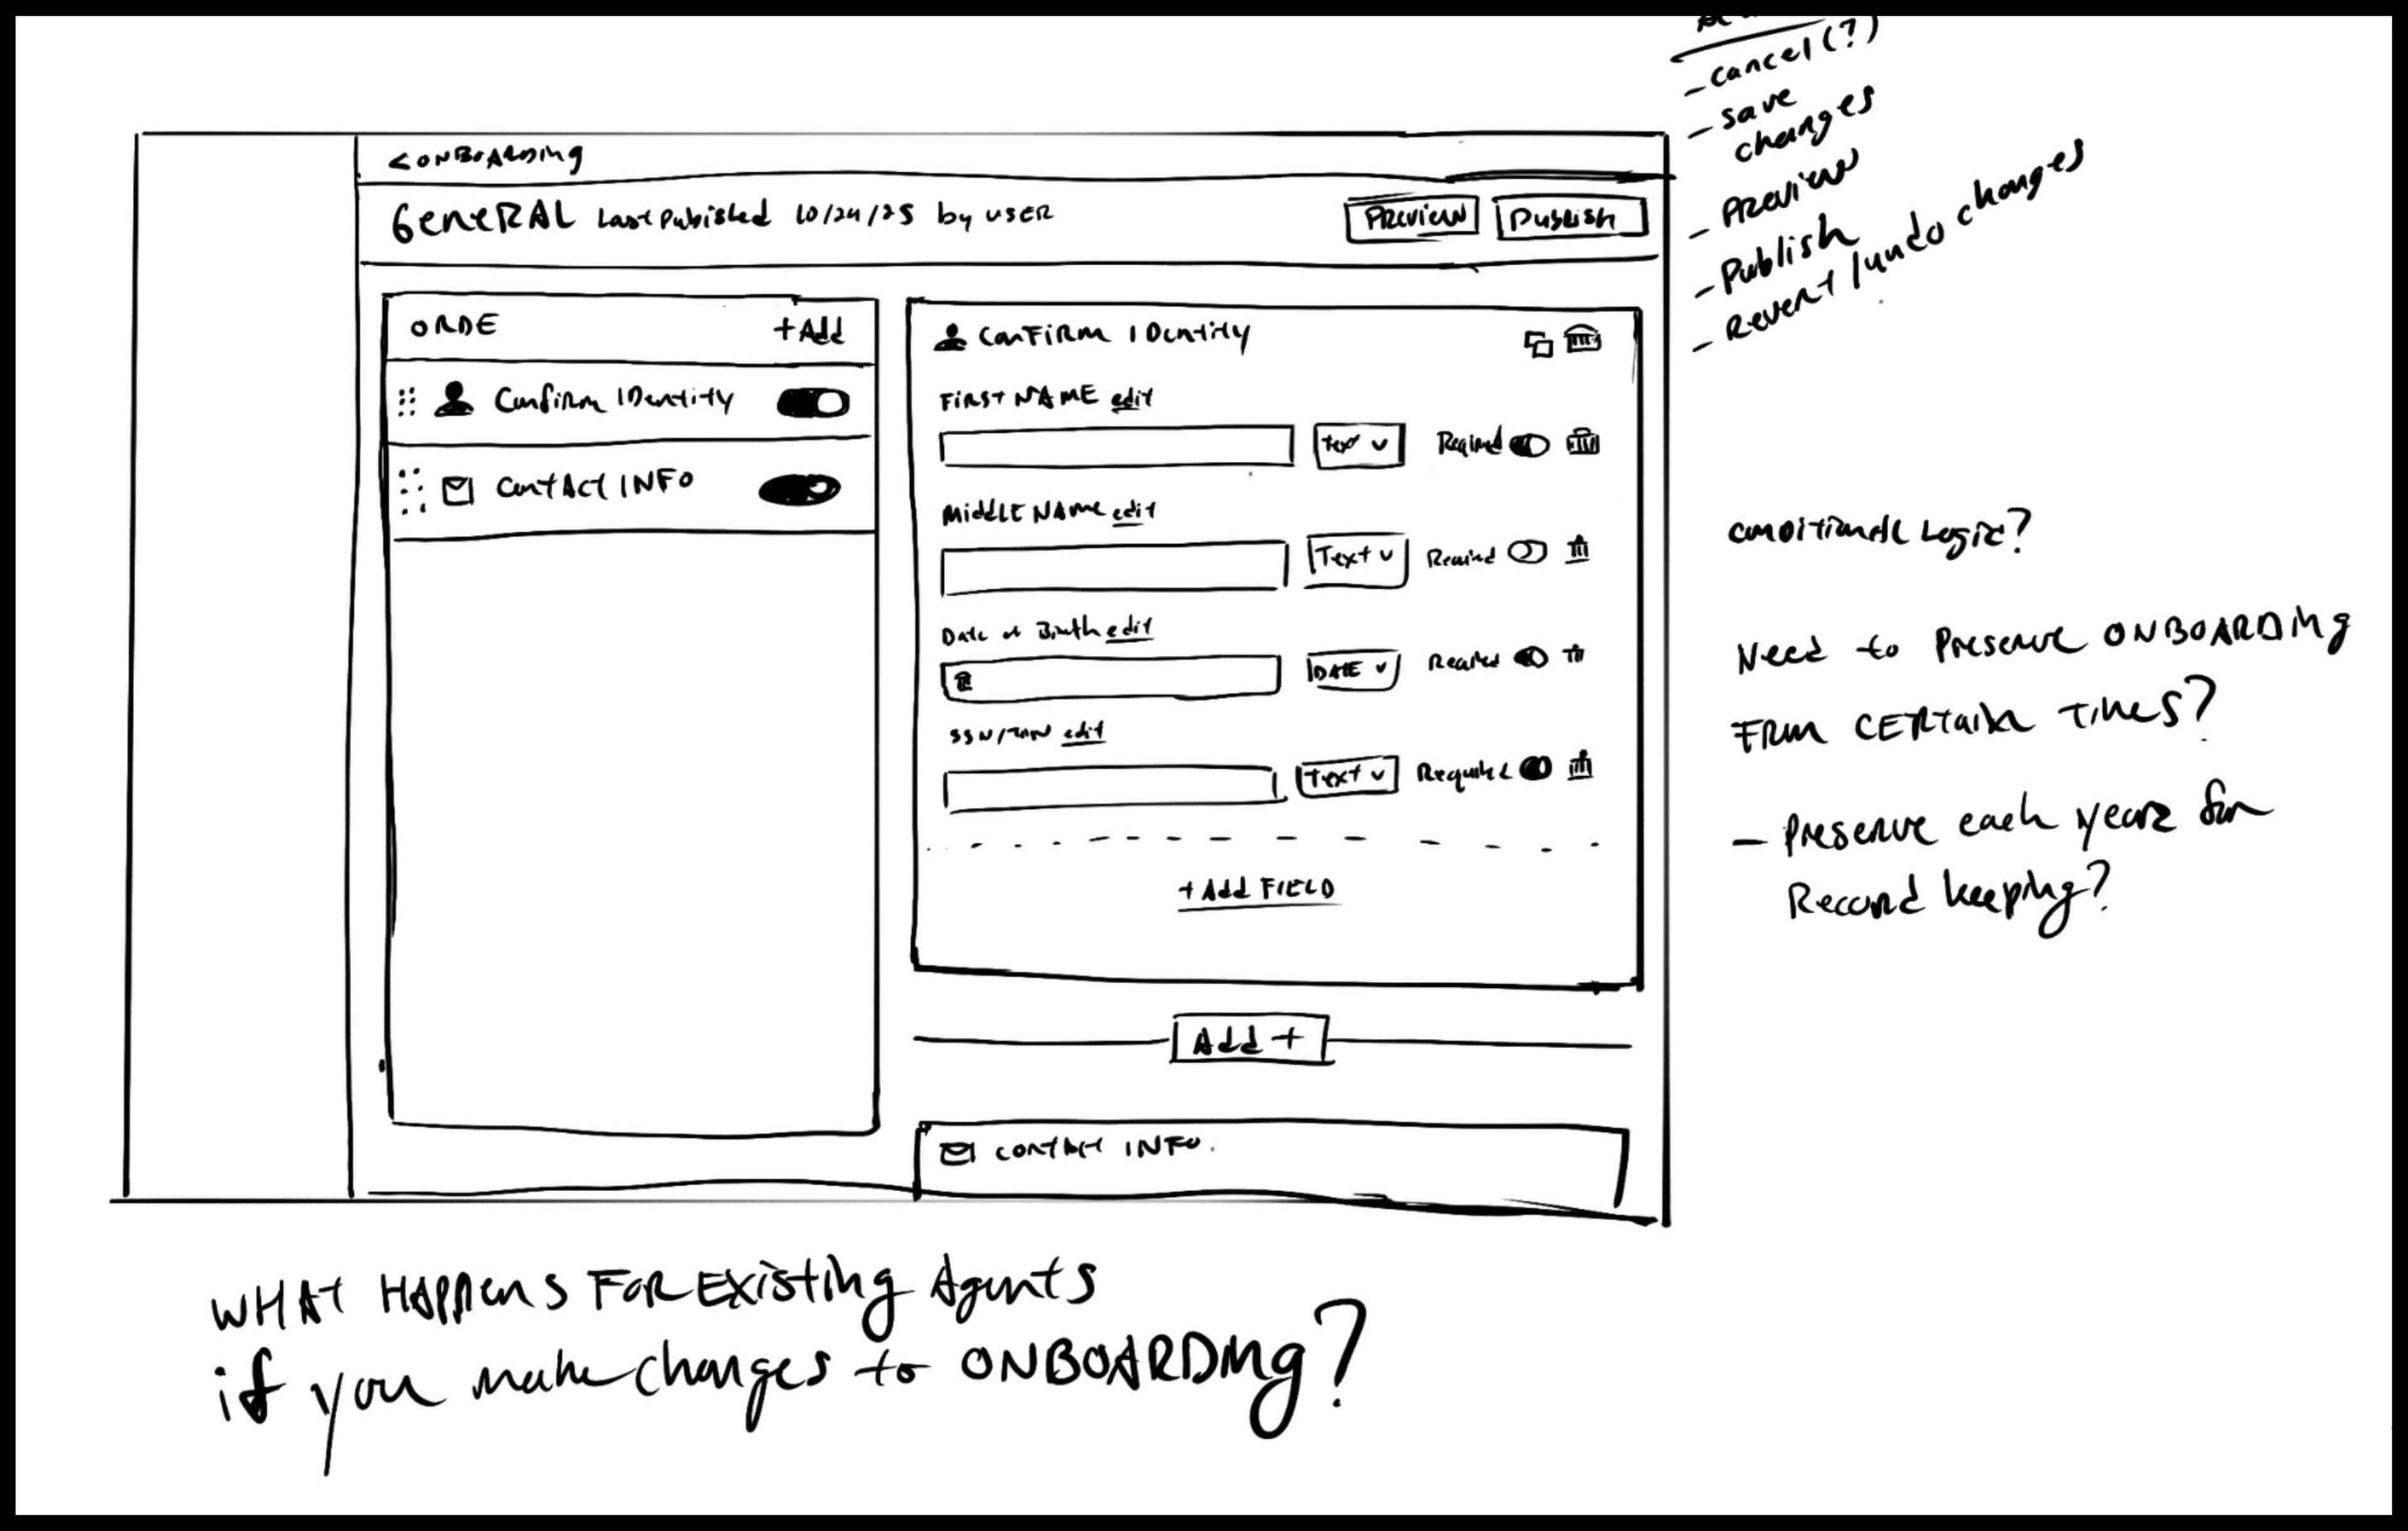
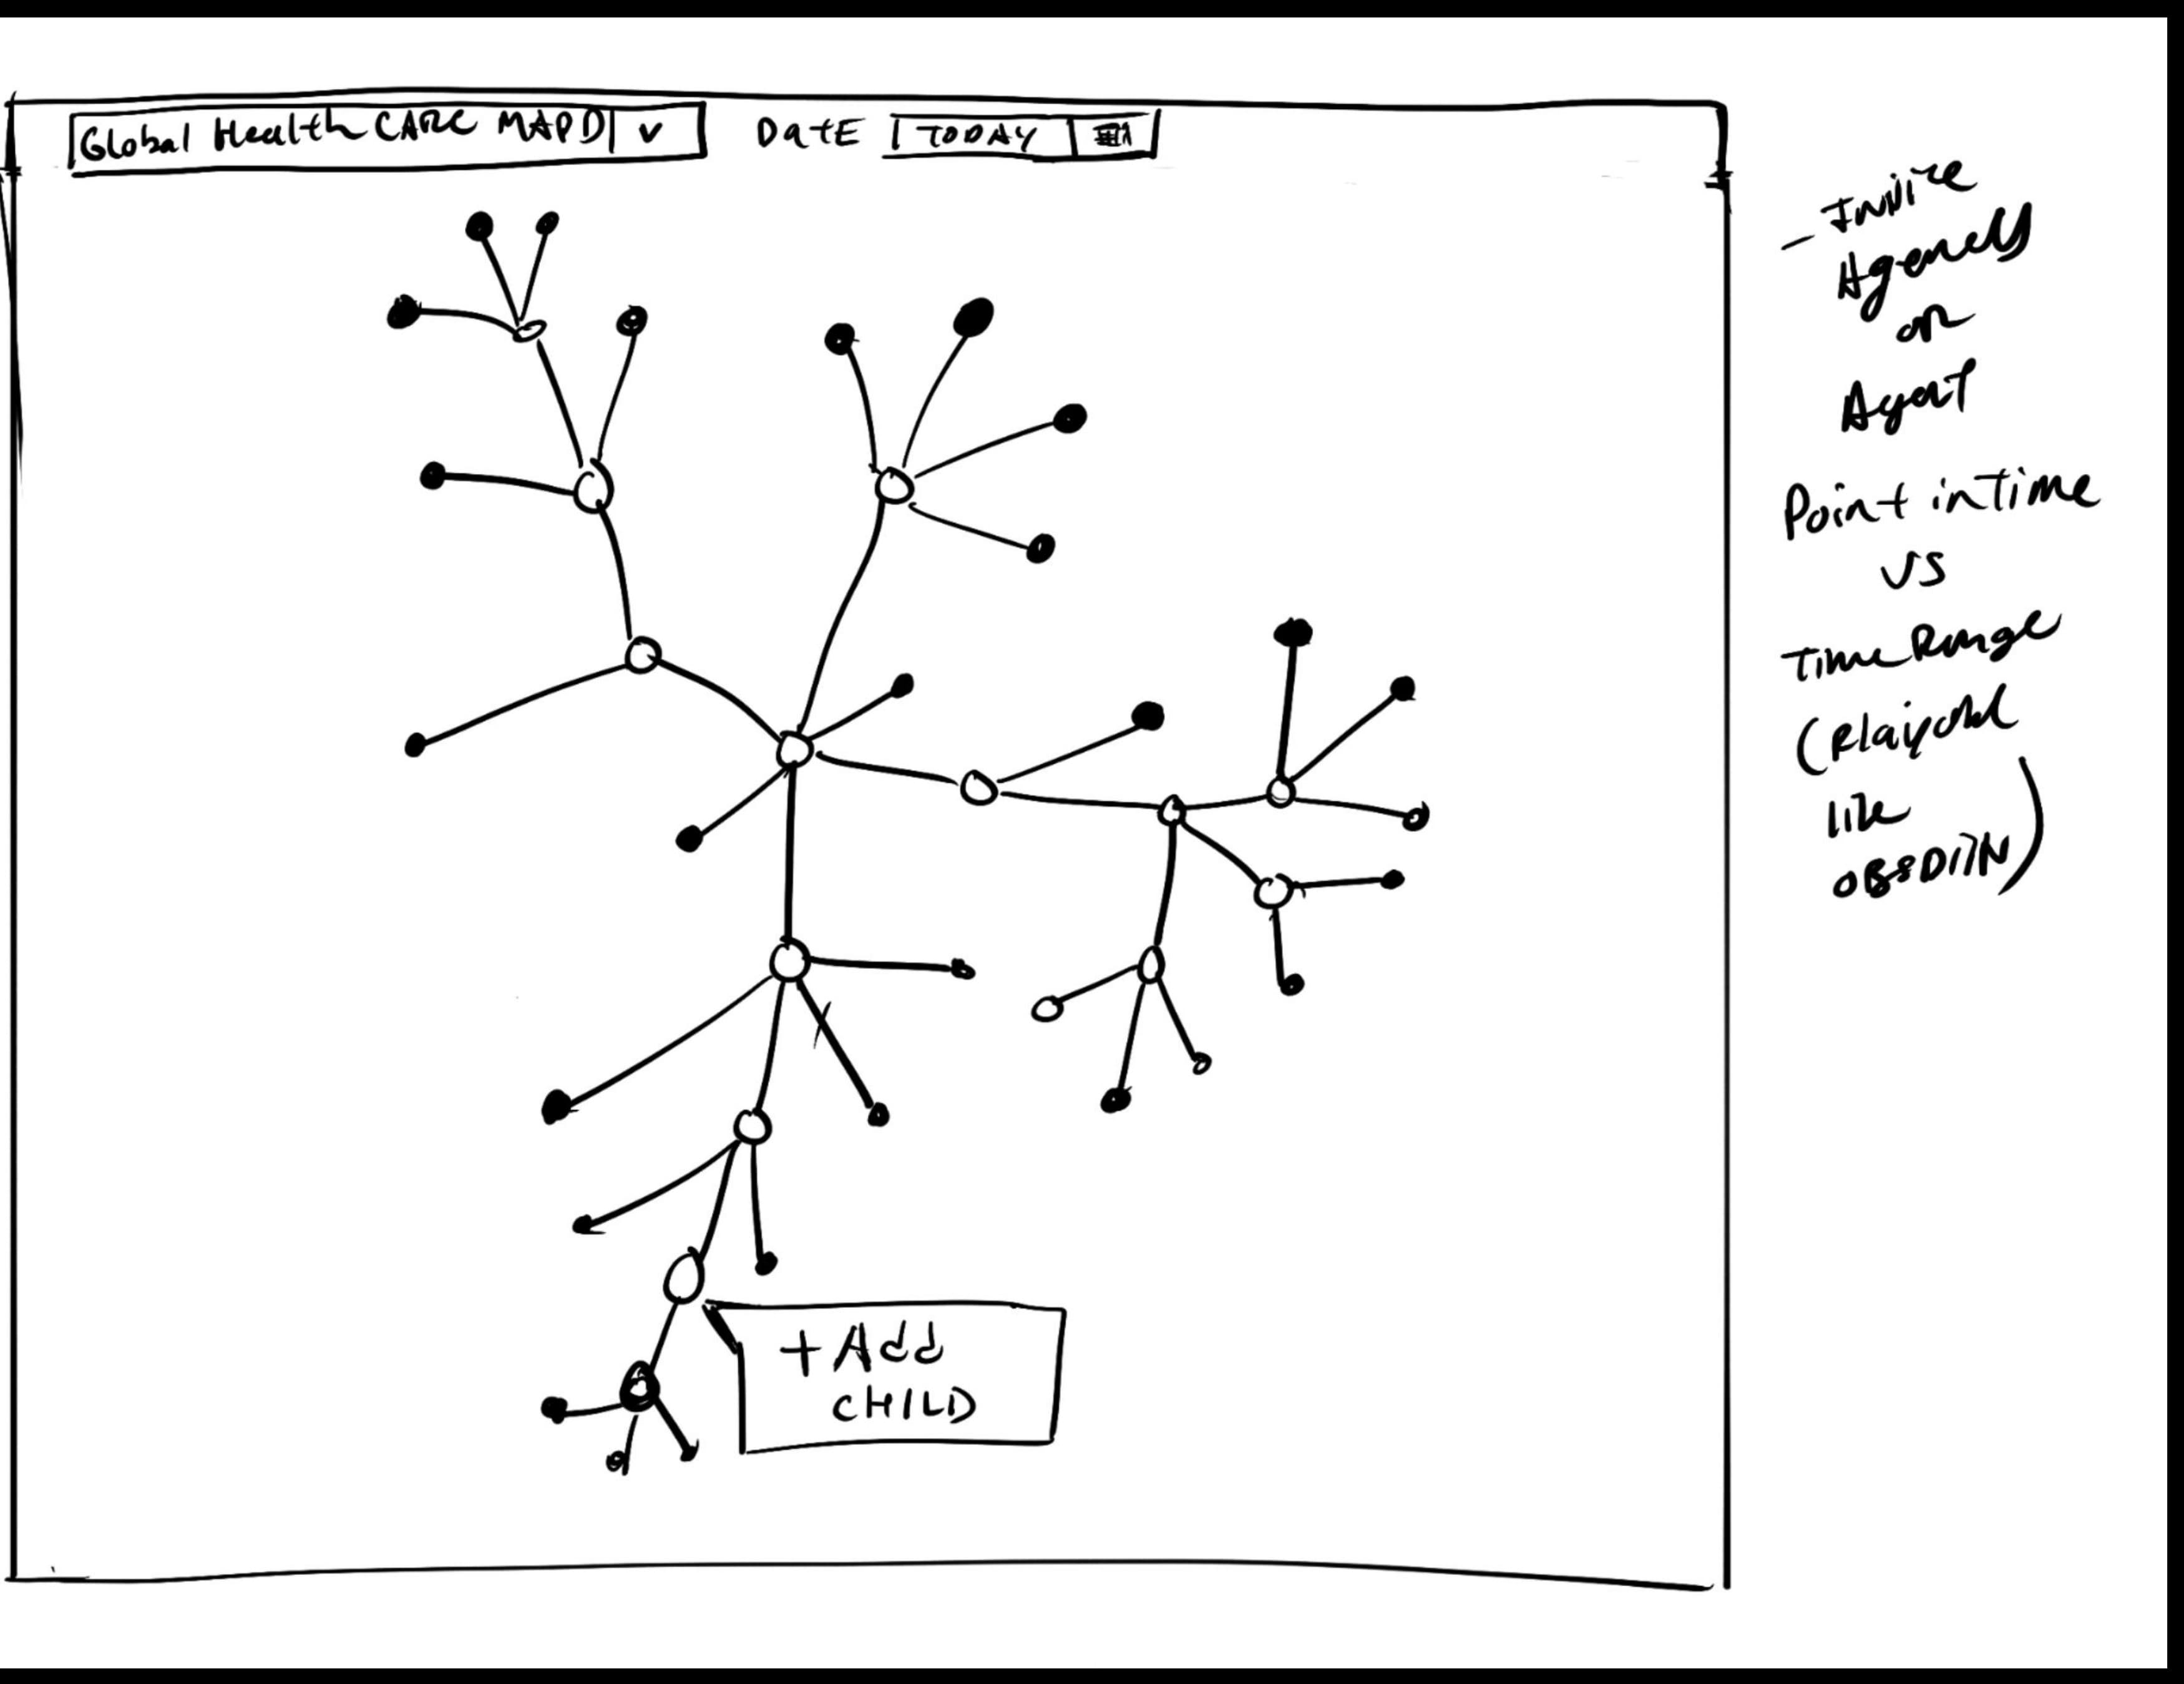
Both products started as hand sketches.
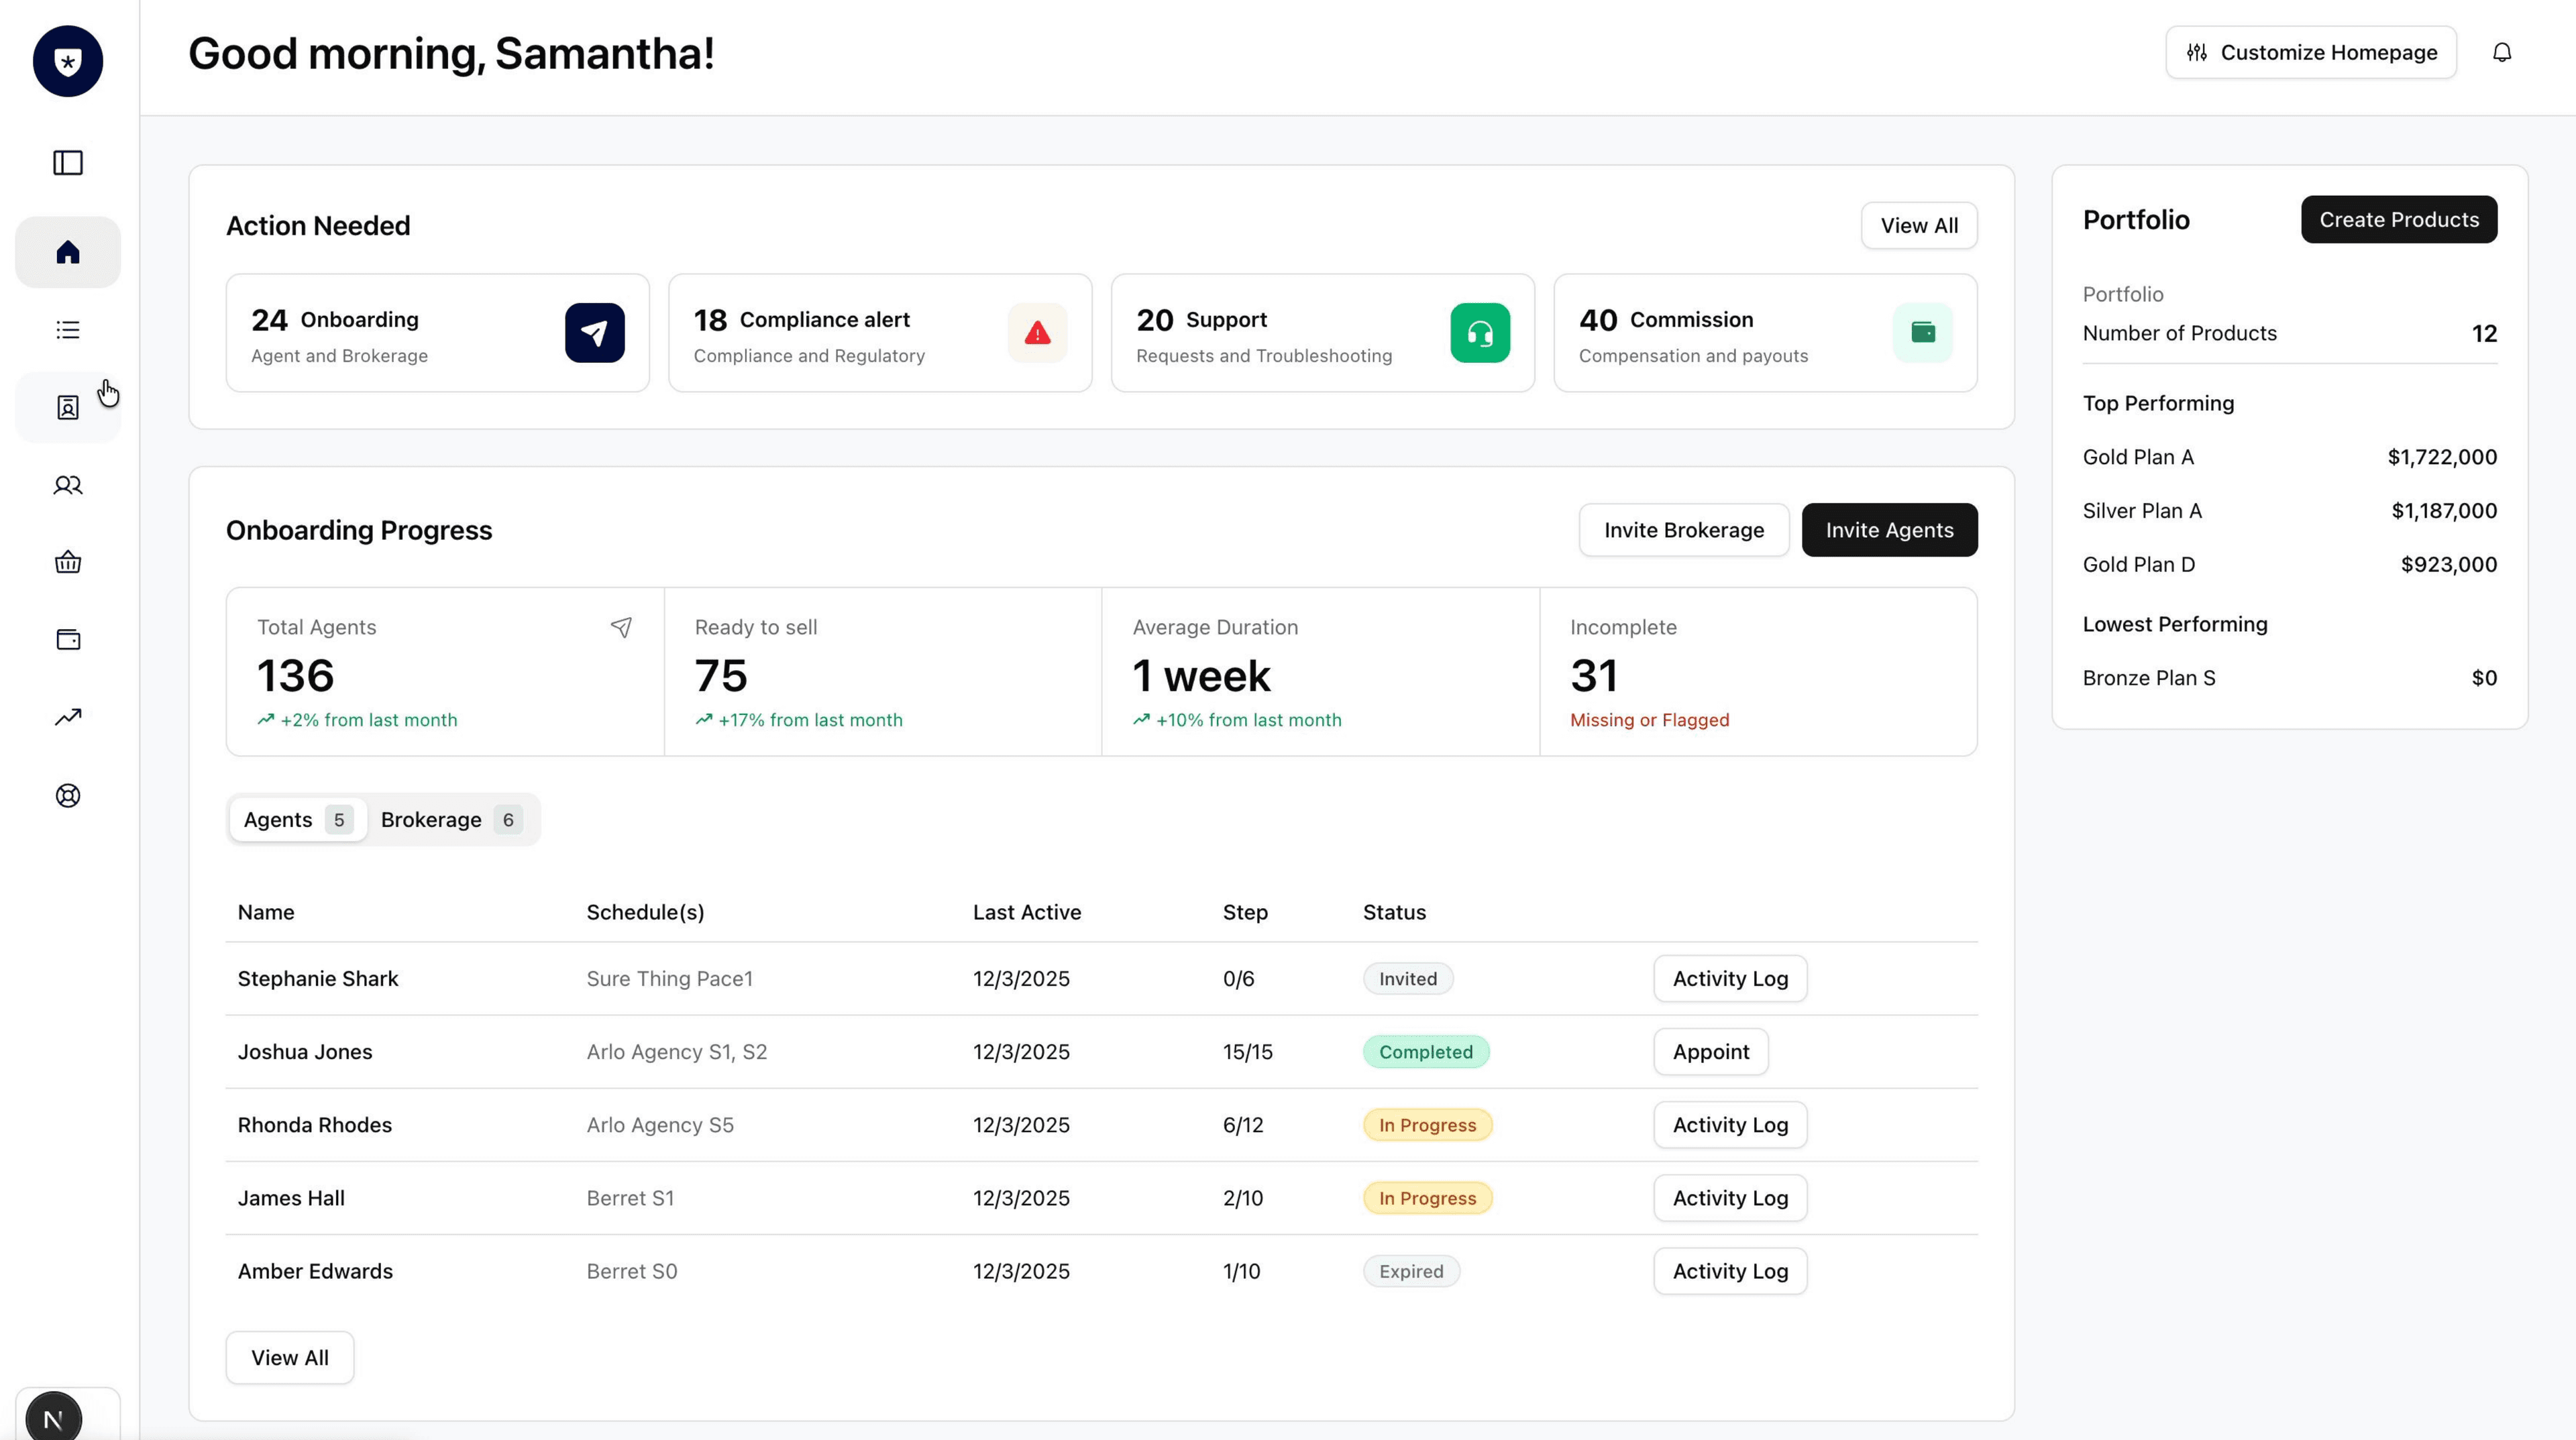
What mattered was how far past the sketch we could take them. Instead of stopping at static Figma frames, we built each idea into working software running on realistic data, deep enough to click through, react to, and decide on. That depth is the thing a sketch or a mockup can never give you.
Product one
A form builder for agent onboarding.
A complete, working prototype: build an onboarding flow from drag-and-drop steps and fields, publish it, and track agents as they move through it. A solid product in its own right.
Product two
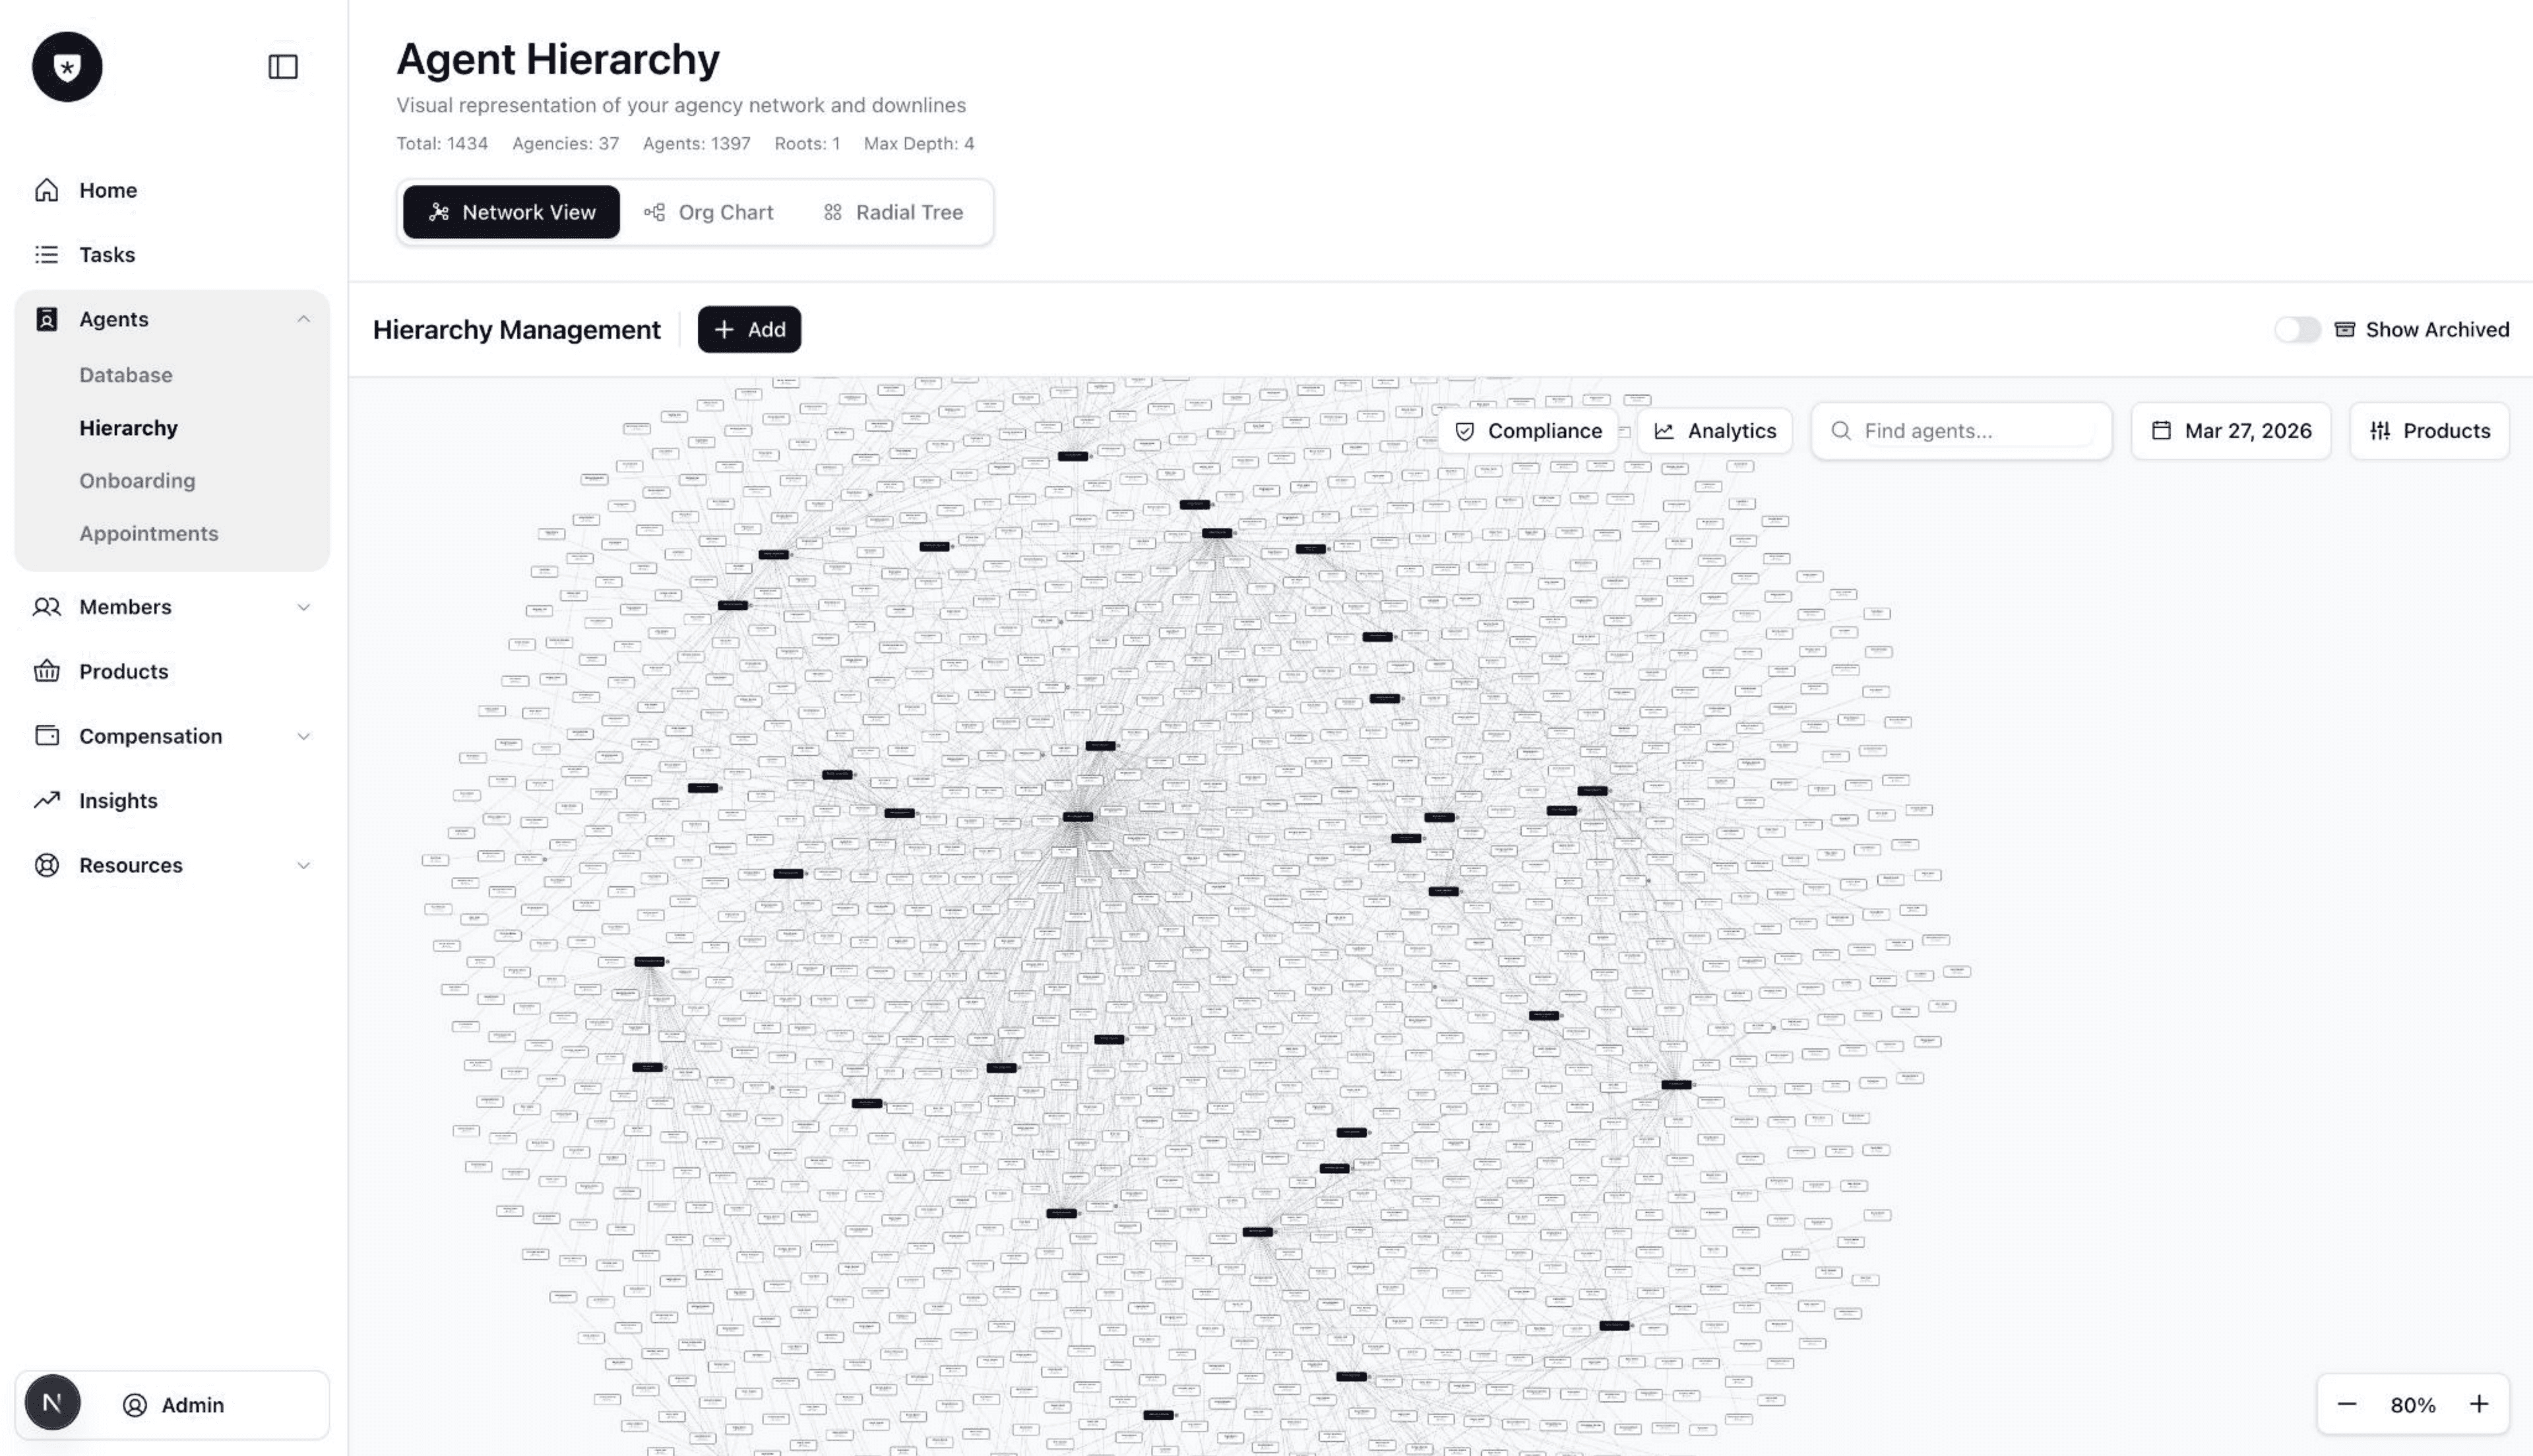
A visualizer and manager for the whole network.
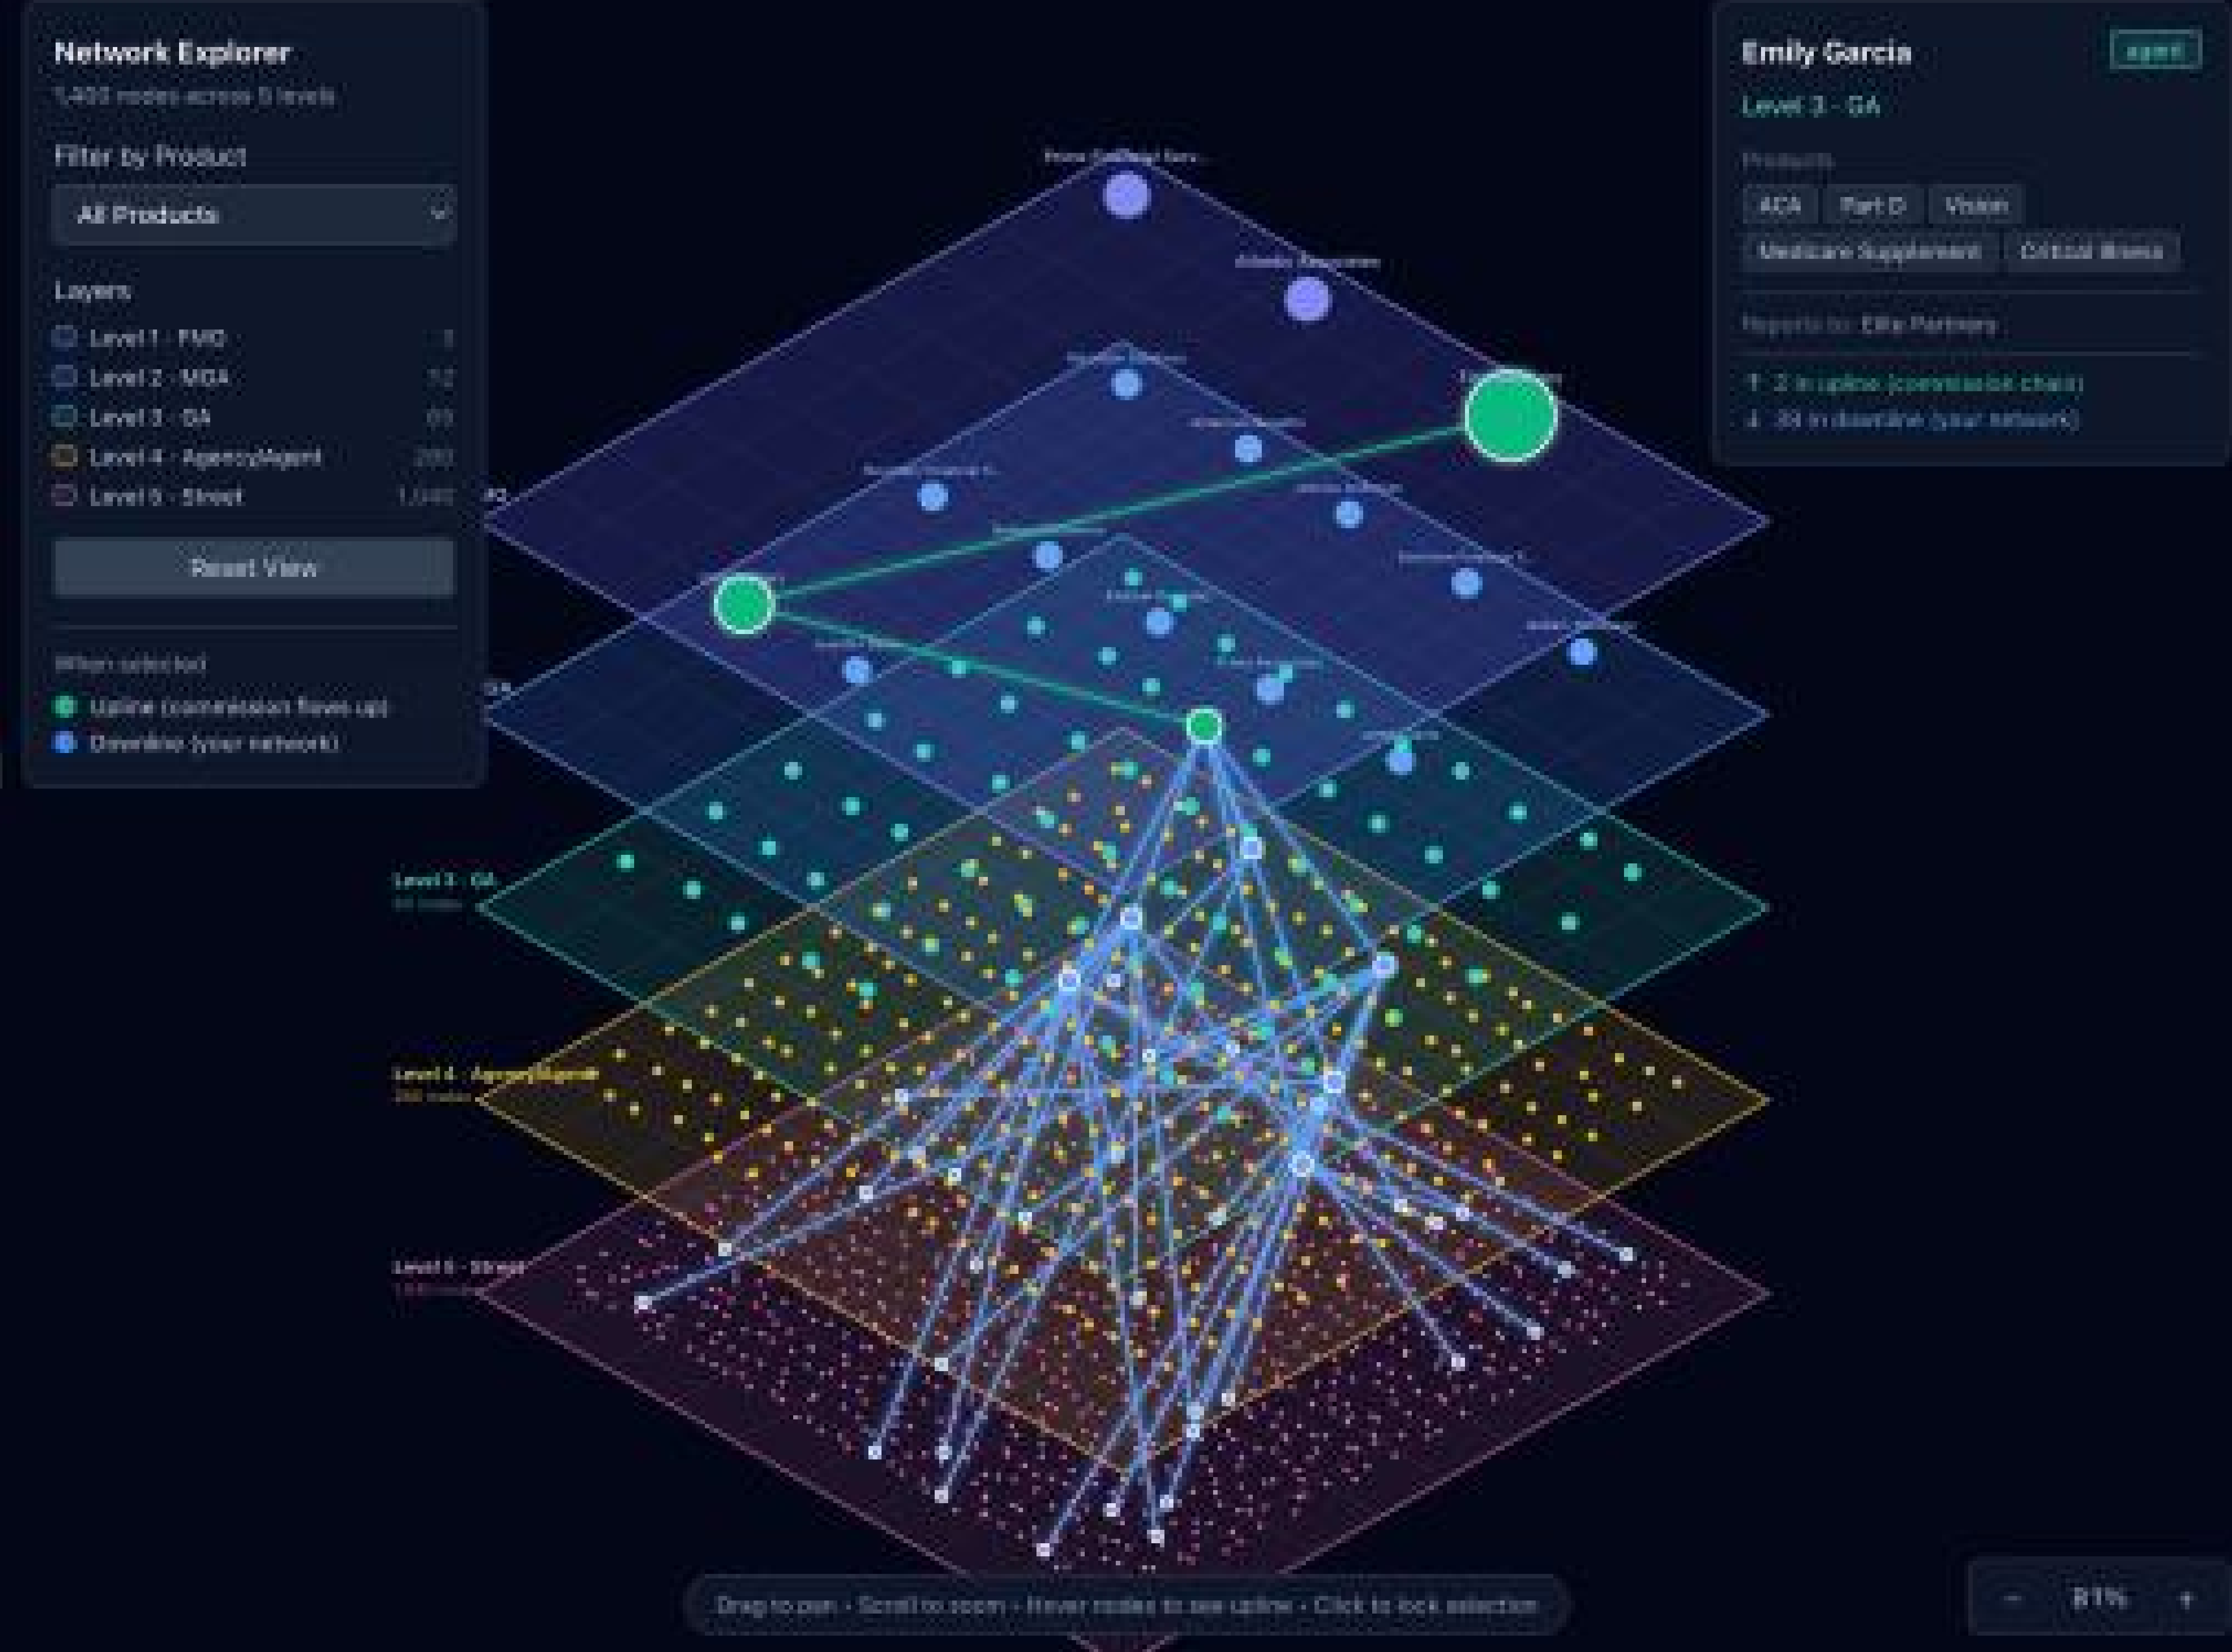
The other prototype turns the entire agent network into something you can see, search, and change. Reassign an agency or apply a product across a whole downline in one visible action, instead of editing a wall of tables.
Explorations
Charts that sounded good, but weren't the answer.
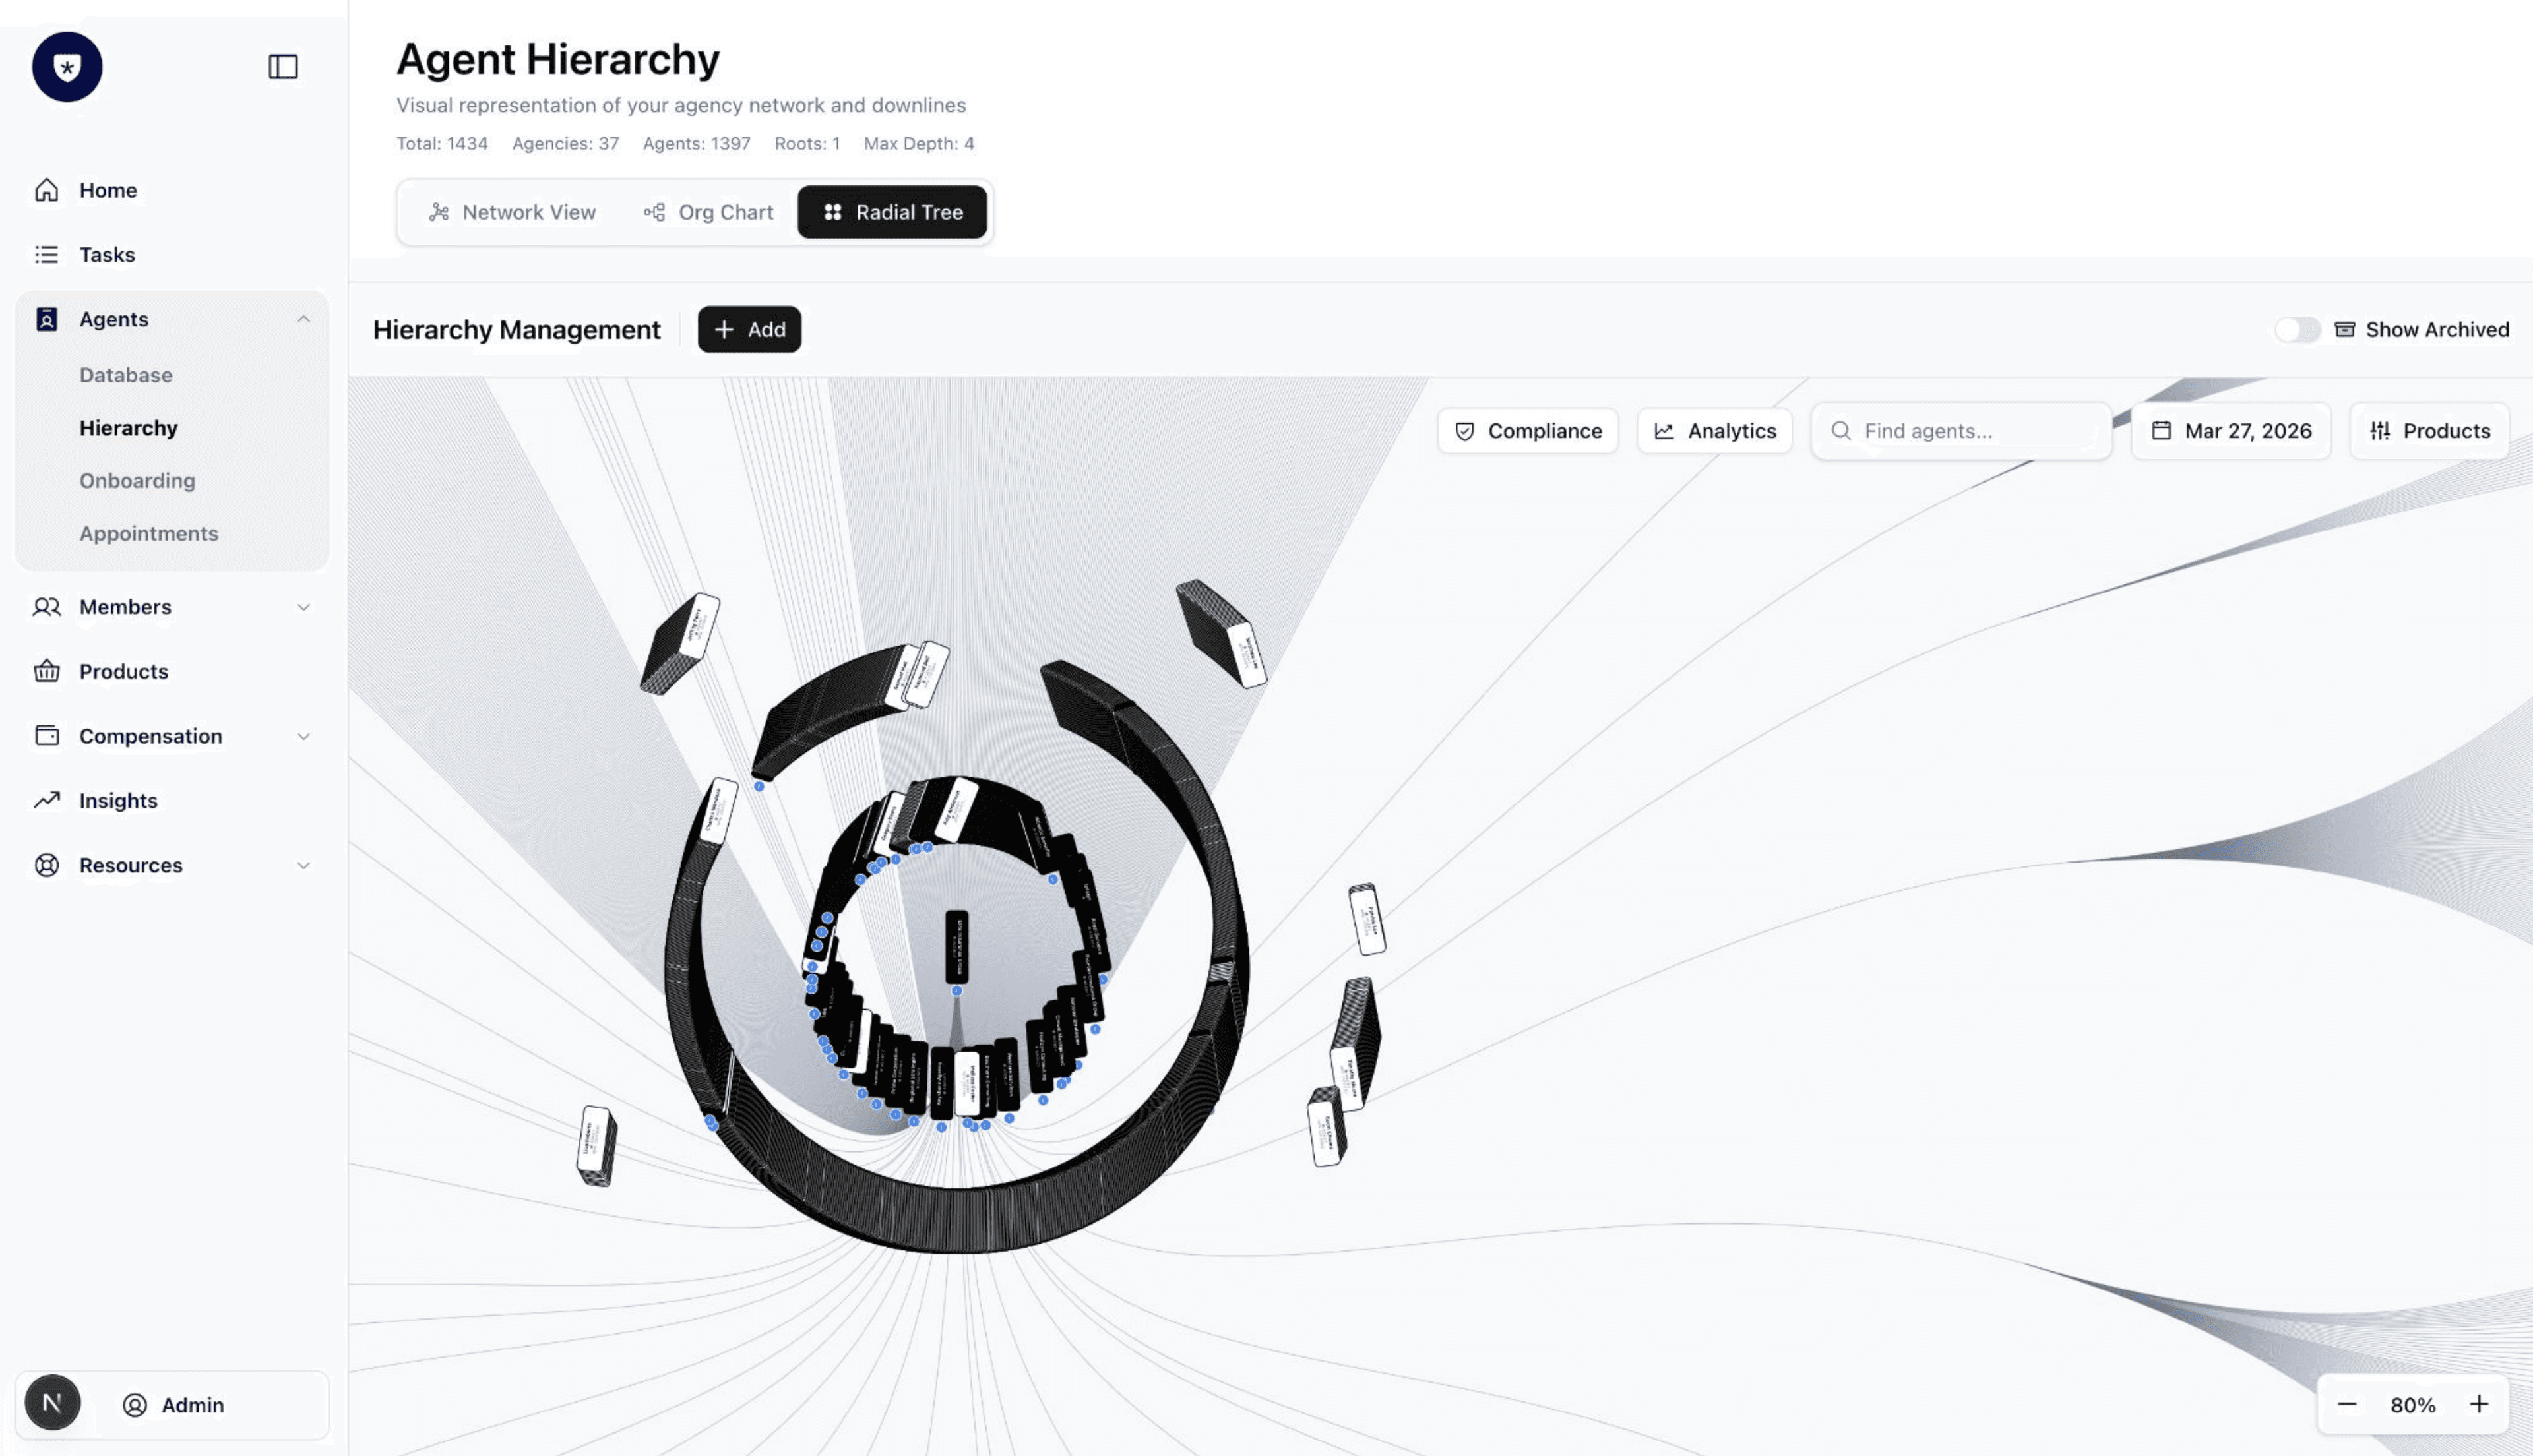
Before the network view landed, we built and killed several other visualizations. Each was compelling in a pitch and useless in practice. Building them for real, on the same 1,000-agent dataset, made the wrong answers obvious fast.
Outcome
e123 chose the network visualizer and greenlit it as the next product on their roadmap, replacing a tool that was essentially a wall of tables.
Seeing both as working software made the call clear: stakeholders and real customers reacted to the network prototype in a way the spreadsheets it replaces never earned. Building with Claude Code, two designers took two products from idea to convincing, data-backed prototype in five weeks.